DASHBOARDS & ALERTS
Continuous Commercial Visibility
Continuous Commercial Visibility
Continuous Commercial Visibility
National, longitudinal medical and pharmacy claims attributed to facilities, providers, payers, and geographies — powering defensible commercial decisions.
Transform facility-attributed claims into heatmaps, rankings, and automated signals that surface meaningful territory and market shifts before planning cycles close.
Transform facility-attributed claims into heatmaps, rankings, and automated signals that surface meaningful territory and market shifts before planning cycles close.

Decision-Ready Intelligence
Move beyond static reporting. Monitor utilization, penetration, and payer shifts continuously across territories and facilities.

Facility Heatmaps
Visualize patient concentration by territory and care site.

Territory Rankings
Prioritize regions using penetration and demand metrics.

Trend Monitoring
Track utilization growth or decline over time.

Automated Alerts
Surface material shifts without manual analysis.
Facility Heatmaps
Visualize patient concentration by territory and care site.
Territory Rankings
Prioritize regions using penetration and demand metrics.
Trend Monitoring
Track utilization growth or decline over time.
Automated Alerts
Surface material shifts without manual analysis.
Longitudinal Medical & Rx
Adjudicated claims forming the foundation for analytics.
Territory Rankings
Prioritize regions using penetration and demand metrics.
Trend Monitoring
Track utilization growth or decline over time.
Automated Alerts
Surface material shifts without manual analysis.
Visualize Where Care Is Delivered
Understand patient concentration at the facility and territory level through dynamic, attributed heatmaps.
Facility-level demand visualization
Territory-aligned concentration mapping
Regional demand comparisons
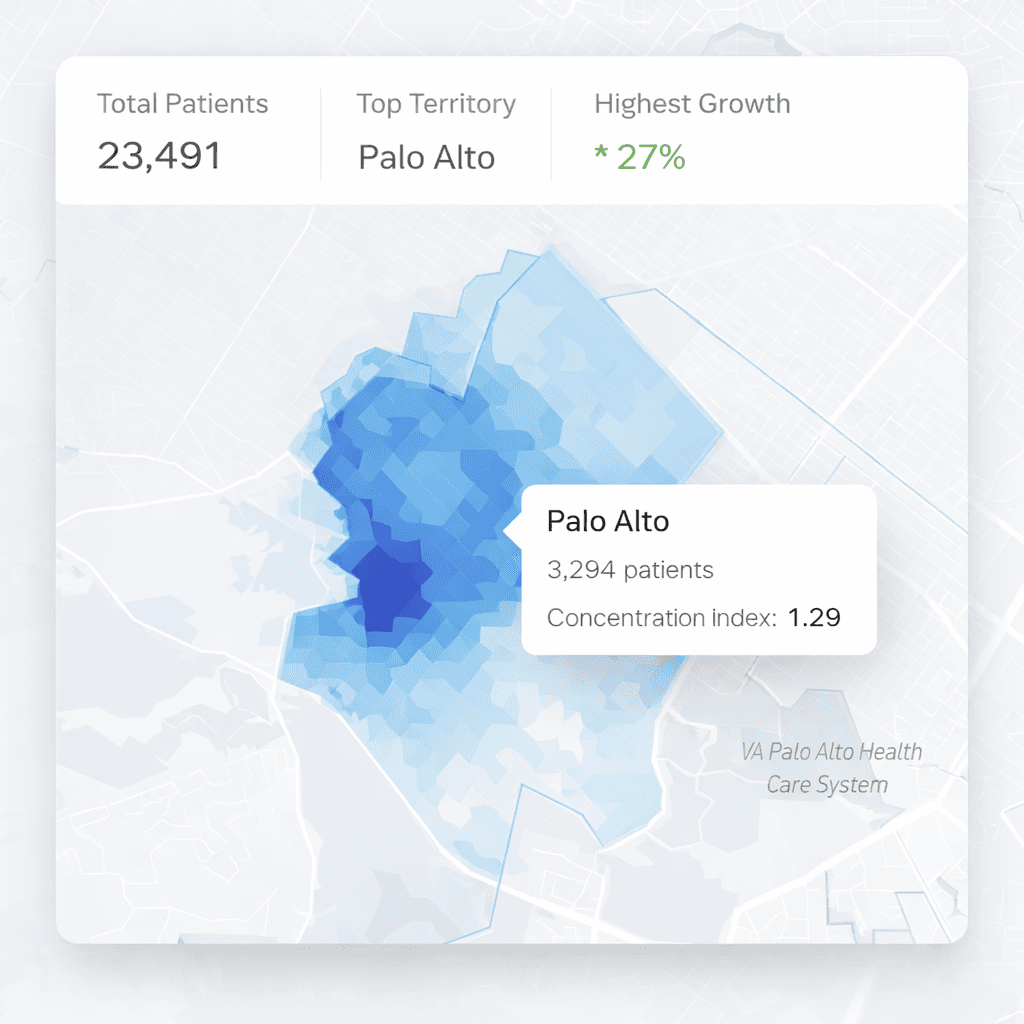
See Demand Instantly
Move beyond spreadsheets to interactive maps that reflect how care is actually distributed across your market.
Facility Concentration Map

Delivered in 1 Week
Recent claims analysis completed within one week of scoping.
Self-Serve Control

Delivered in 1 Week
Recent claims analysis completed within one week of scoping.
Self-Serve Control
Visualize Where Care Is Delivered
Understand patient concentration at the facility and territory level through dynamic, attributed heatmaps.
Facility-level demand visualization
Territory-aligned concentration mapping
Regional demand comparisons
See Demand Instantly
Move beyond spreadsheets to interactive maps that reflect how care is actually distributed across your market.
Facility Concentration Map
Delivered in 1 Week
Recent claims analysis completed within one week of scoping.
Self-Serve Control
Delivered in 1 Week
Recent claims analysis completed within one week of scoping.
Self-Serve Control
Visualize Where Care Is Delivered
Understand patient concentration at the facility and territory level through dynamic, attributed heatmaps.
Facility-level demand visualization
Territory-aligned concentration mapping
Regional demand comparisons
Rank and Prioritize Territories
Measure penetration and performance against demand to guide field deployment and resource allocation.
Territory-level penetration scoring
Demand vs performance comparison
Region prioritization tables
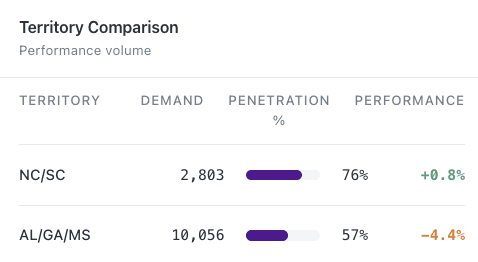
Rank regions based on demand and coverage
Focus commercial effort where patient volume is concentrated and under-penetration is measurable.
Territory Performance Table
Delivered in 1 Week
Recent claims analysis completed within one week of scoping.
Self-Serve Control
Delivered in 1 Week
Recent claims analysis completed within one week of scoping.
Self-Serve Control
Rank and Prioritize Territories
Measure penetration and performance against demand to guide field deployment and resource allocation.
Territory-level penetration scoring
Demand vs performance comparison
Region prioritization tables
White Space Identified
Focus commercial effort where patient volume is concentrated and under-penetration is measurable.
Territory Performance Table
Delivered in 1 Week
Recent claims analysis completed within one week of scoping.
Self-Serve Control
Delivered in 1 Week
Recent claims analysis completed within one week of scoping.
Self-Serve Control
Rank and Prioritize Territories
Measure penetration and performance against demand to guide field deployment and resource allocation.
Territory-level penetration scoring
Demand vs performance comparison
Region prioritization tables
Track Market Movement Over Time
Monitor shifts in utilization, payer mix, and regional growth to detect emerging opportunity or decline.
Quarter-over-quarter utilization changes
Regional growth tracking
Payer distribution movement

Early Signal Detection
Surface growth or decline patterns early enough to adjust strategy before the next commercial review.
Utilization Trend Dashboard
Delivered in 1 Week
Recent claims analysis completed within one week of scoping.
Self-Serve Control
Delivered in 1 Week
Recent claims analysis completed within one week of scoping.
Self-Serve Control
Track Market Movement Over Time
Monitor shifts in utilization, payer mix, and regional growth to detect emerging opportunity or decline.
Quarter-over-quarter utilization changes
Regional growth tracking
Payer distribution movement
Automated Commercial Signals
Configure thresholds to receive alerts when meaningful changes occur in penetration, demand, or concentration.
Penetration drop detection
Emerging high-demand regions
Payer mix shifts

From Insight to Action
Eliminate manual report review and ensure leadership is notified when the market moves.
Alert Notification Panel
Delivered in 1 Week
Recent claims analysis completed within one week of scoping.
Self-Serve Control
Delivered in 1 Week
Recent claims analysis completed within one week of scoping.
Self-Serve Control
Automated Commercial Signals
Configure thresholds to receive alerts when meaningful changes occur in penetration, demand, or concentration.
Penetration drop detection
Emerging high-demand regions
Payer mix shifts
Always Up to Date
Eliminate manual report review and ensure leadership is notified when the market moves.
Alert Notification Panel
Delivered in 1 Week
Recent claims analysis completed within one week of scoping.
Self-Serve Control
Delivered in 1 Week
Recent claims analysis completed within one week of scoping.
Self-Serve Control
Automated Commercial Signals
Configure thresholds to receive alerts when meaningful changes occur in penetration, demand, or concentration.
Penetration drop detection
Emerging high-demand regions
Payer mix shifts